
Heat Map questions are a great way to get input and feedback on specific elements of images and other visuals to be tested.
- Creative (packaging, advertisements, layouts, etc.)
- Web mock-ups (not only can you get design feedback, you can even get some basic UX with time-to-task measurement, see Timed Heat Map below.
- Text/content (just show an image of the text you want people to react to and let them mark what they like, what is confusing and so forth – just like the big white boards for in-person focus groups).
- Any other images.
Respondents can be asked which part of the image catches their eye, is most appealing, important, confusing, etc.
Three Types of Heat Map Questions
- Heat Map: This question type allows you to create an infinite number of categories and have users drop customizable (icon shape, faces, colors) marofkers on the stimuli. You can set a minimum and maximum number markers that respondents can drop on the image.
- Timed Heat Map: This question type is similar to the simple heat map but also measures the time it takes for users to drop each marker. This feature is especially relevant when testing website usability: e.g., show Webpage version A and ask "where would you click to edit your cart," then show Webpage version B and ask the same. Compare how long it took to find the "edit cart" button on version A vs. B and you have some amazingly fast and powerful UX insights.
- Sticky Note: This is the most popular Heat Map question. It works just like the regular Heat Map, but users can add context to each marker and explain why they placed it as they did. Each time a respondent places a marker, a pop-up will prompt him/her to type in the reason for the placement.
Programming Steps
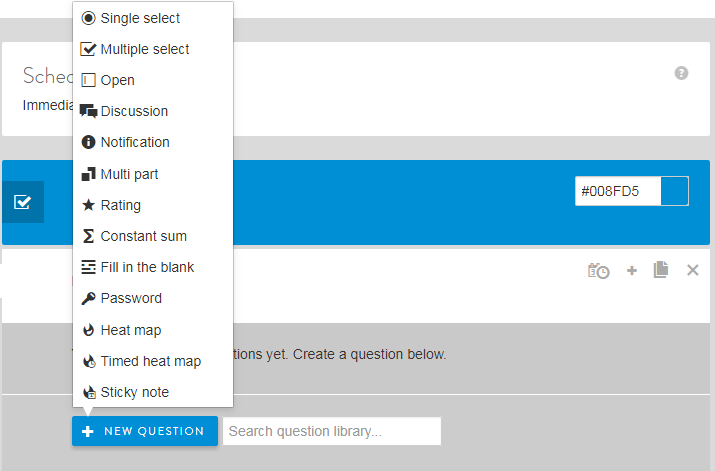
From the New Question dropdown menu, select the heat map question best suited for your research needs.
Next, enter and update the following:
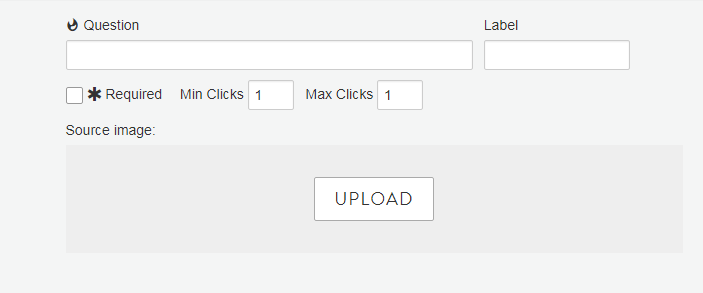
- Question text and a label, if desired (labels are not shown to respondents but can be used for back-end reporting).
- Select checkbox if you want to make the question required (all have to answer it to go to the next survey screen).
- Update Min - Max clicks, if desired. This sets how many times respondents have to click on the image.
- For example, a question could be: "Please mark up to three things you like about this photo and up to three things you don’t like." You would set your Min Clicks as 1 and your Max Clicks as 3.
- Note: you are not able to set different Min - Max Clicks for different categories, e.g. likes vs. dislikes.
- Make sure your question text is clear, so members know what to do, e.g. how many click are expected, etc.
- Upload an image.
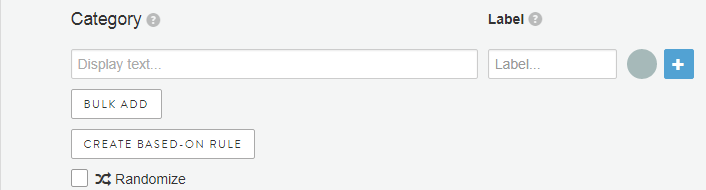
- Create your categories. This step is easily forgotten but is very important. Here you specify what you want members to tell you about. You can create one category or multiple (Bulk add is available). Limit to no more than 2 or 3 categories to avoid respondent issues include confusion and fatigue.
- Categories can be randomized, if applicable to research needs.
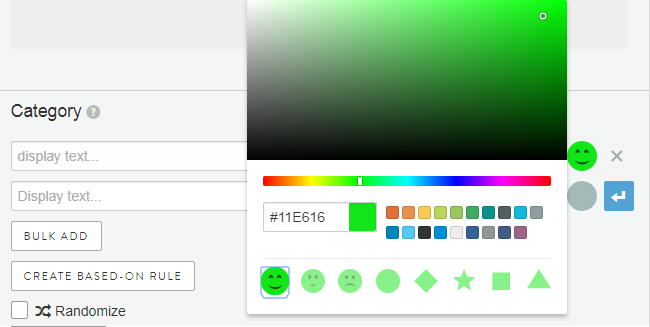
- Customize the icon respondents place on the image:
- Click on the grey circle to the right of each category label.
- In the pop-up window, choose a color and/or icon. For example, a green smiley face is a good icon for "likes."
- Finally, click the Finished button to save your heat map question.
Programming of Timed Heat Map and Sticky Notes
The steps are the same for Timed Heat Maps and Sticky Notes. The only programming difference is for a Timed Heat Map question. Only one category is available, so this step can be skipped.
Reporting
- View the heat map or raw markers.
- Change the color scheme for your reporting.
- Add and remove categories from the heat map.
- See interactive counts for each category.
- Click on any comment and the heat map will show you where on the image that comment was made.
- Create areas-of-interest (AOI) on the fly. Just select the area of the image you want to explore (and shrink or expand the square) and then drag it around the image to explore: the charting and all associated comments will automatically update to match your AOI.
- One click to export the heat map with your defined color scheme, AOI and more for easy integration in your reports.
For a sample of what reporting will look like please click here.

Continue reading:
For more details see:
Comments
0 comments
Article is closed for comments.